puppeteeR can render your graph structure before execution - useful for sanity-checking topology, sharing diagrams, and documentation. Three engines are supported.
Build a sample graph
schema <- workflow_state(
  input    = list(default = ""),
  research = list(default = ""),
  draft    = list(default = ""),
  status   = list(default = "pending")
)

g <- state_graph(schema) |>
  add_node("research", function(s, cfg) list()) |>
  add_node("write",    function(s, cfg) list()) |>
  add_node("review",   function(s, cfg) list()) |>
  add_node("revise",   function(s, cfg) list()) |>
  add_edge(START, "research") |>
  add_edge("research", "write") |>
  add_edge("write", "review") |>
  add_conditional_edge(
    "review",
    routing_fn = function(s) if (s$get("status") == "approved") "done" else "needs_work",
    route_map  = list(done = END, needs_work = "revise")
  ) |>
  add_edge("revise", "write")
Mermaid (text output, zero dependencies)
as_mermaid() returns a Mermaid flowchart string. Paste
it into mermaid.live or embed it in
any Markdown that supports Mermaid fences.
cat(g$as_mermaid())
#> graph TD
#>   START((START)) --> research[research]
#>   research[research] --> write[write]
#>   write[write] --> review[review]
#>   revise[revise] --> write[write]
#>   review[review] -- "done" --> END((END))
#>   review[review] -- "needs_work" --> revise[revise]
DOT / Graphviz (requires DiagrammeR)
as_dot() returns a Graphviz DOT string.
visualize("dot") renders it as an interactive widget.
cat(g$as_dot())
#> digraph workflow {
#>   graph [rankdir=TB fontname="Helvetica" bgcolor="transparent"]
#>   node  [shape=rect style="rounded,filled" fontname="Helvetica" fillcolor="#E8F0FE" color="#4A90D9"]
#>   edge  [fontname="Helvetica" fontsize=10 color="#666666"]
#>
#>   __START__ [label="START" shape=oval fillcolor="#2D3748" fontcolor=white]
#>   __END__   [label="END"   shape=oval fillcolor="#2D3748" fontcolor=white]
#>   research [label="research"]
#>   write [label="write"]
#>   review [label="review" fillcolor="#FFF3CD"]
#>   revise [label="revise"]
#>   __START__ -> research
#>   research -> write
#>   write -> review
#>   revise -> write
#>   review -> __END__ [label="done" style=dashed]
#>   review -> revise [label="needs_work" style=dashed]
#> }
# Renders in RStudio Viewer / HTML output
g$visualize("dot")
Node colours:
-
Blue (
#E8F0FE) - regular nodes -
Yellow (
#FFF3CD) - nodes with conditional outgoing edges - Dark - START and END sentinels
visNetwork (interactive, requires visNetwork)
Produces a pan-and-zoom interactive network widget. Solid lines = fixed edges, dashed lines = conditional edges (labelled with the routing key).
g$visualize("visnetwork")Export to file
Export the DOT diagram to SVG or PNG (requires
DiagrammeR, DiagrammeRsvg; PNG also needs
rsvg).
g$export_diagram("workflow.svg")
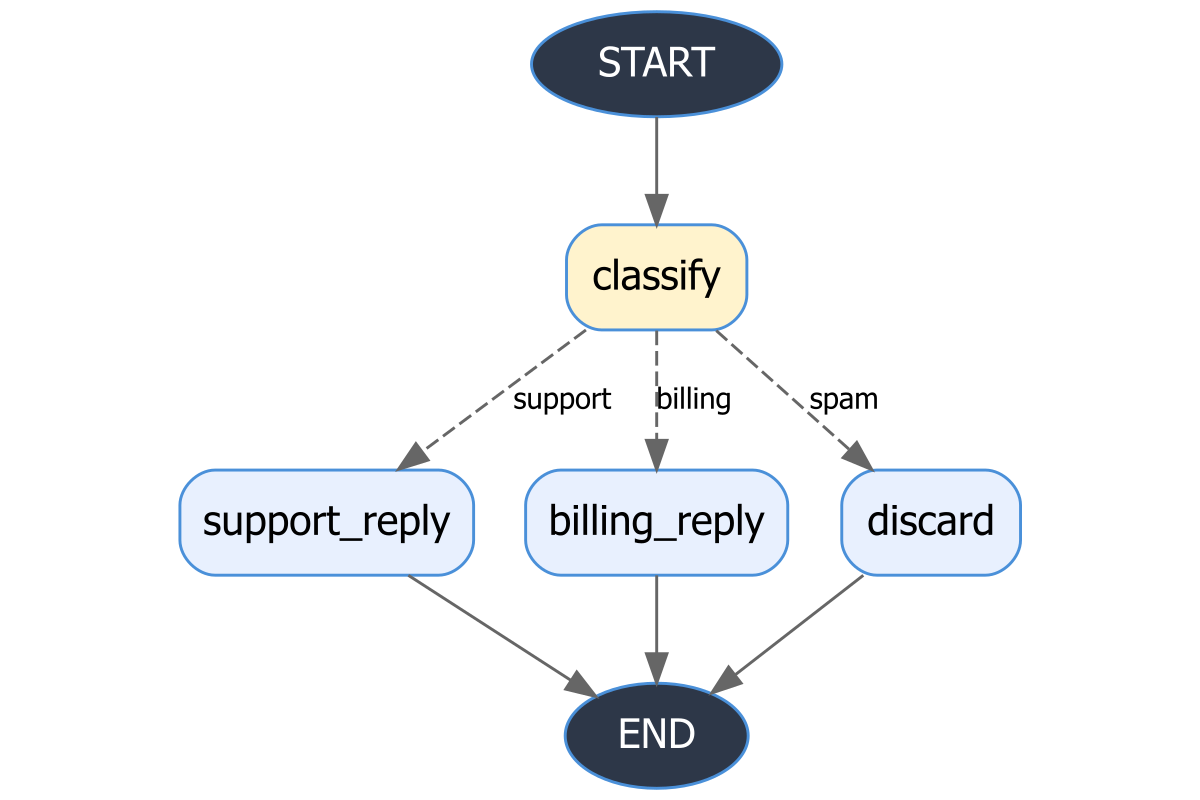
g$export_diagram("workflow.png", width = 1200L, height = 800L)Here is an example PNG exported from the email triage graph (classify - route to support/billing/discard):
Visualizing compiled runners
All visualization methods (visualize(),
as_dot(), as_mermaid(),
export_diagram()) work directly on a compiled
GraphRunner - no need to keep a separate reference to the
graph:
runner <- state_graph(schema) |>
  add_node("a", function(s, cfg) list()) |>
  add_edge(START, "a") |>
  add_edge("a", END) |>
  compile()

# All of these work on the runner directly
runner$visualize("dot")
runner$visualize("visnetwork")
cat(runner$as_mermaid())
runner$export_diagram("graph.png")
This is especially convenient with the workflow convenience constructors:
library(ellmer)

runner <- supervisor_workflow(
  manager = agent("manager", chat_anthropic(),
                  instructions = "Delegate to 'writer' or reply 'DONE'."),
  workers = list(writer = agent("writer", chat_anthropic()))
)

runner$visualize("dot")
Print summary
The print() method gives a quick text summary of node
and edge counts:
g
#> ! StateGraph
#>   Nodes (4): "research", "write", "review", and "revise"
#>   Edges: 5 total (4 fixed, 1 conditional)